Benchmarks
Currently outdated.
Thin Wrapper
leanclient is a thin wrapper around the native Lean language server and uses few resources. It is synchronous (blocking), therefore waits for a server response before returning.
See this profile of a benchmark run, where 94% of the time is spent waiting for a server response (_io.BufferedReader.readline).
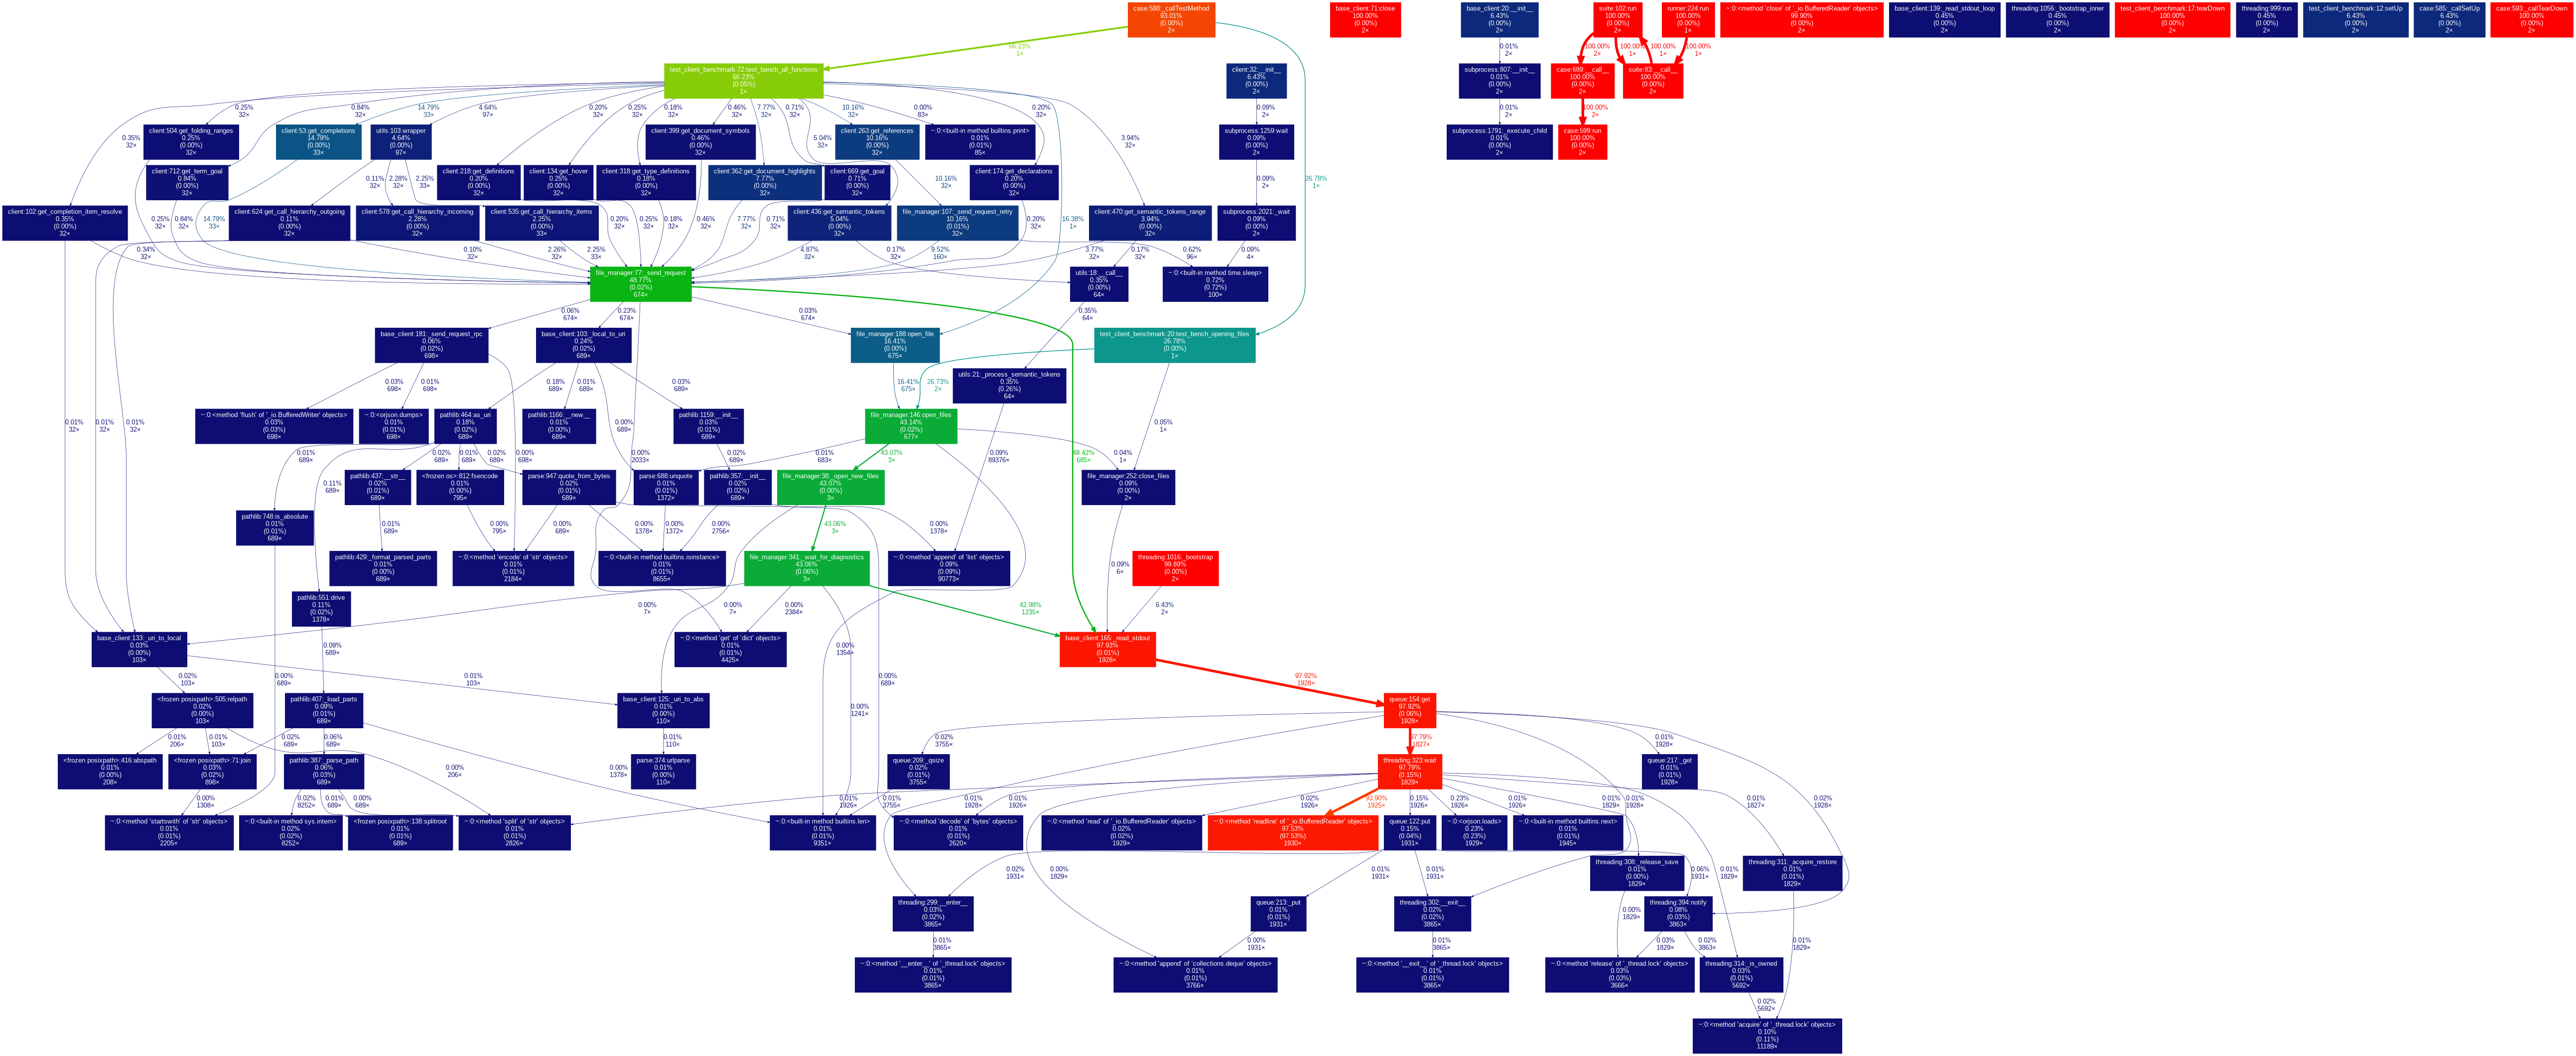
Therefore, these benchmarks are essentially measuring the performance of the Lean language server.
Opening a File
Opening a file in leanclient is completed, when a full diagnostic report (errors, warnings, …) is received. This is highly dependent on the size and complexity of the file. Comparable to the yellow loading bar, when opening a file in VSCode.
Note: Opening multiple files using LeanLSPClient.open_files is typically faster than opening them sequentially.
File Path |
Loading Time [s] |
|---|---|
Tactic/FunProp/Mor.lean |
1.27 |
Tactic/Widget/Calc.lean |
1.54 |
Algebra/Central/Matrix.lean |
1.58 |
Topology/MetricSpace/Ultra/ContinuousMaps.lean |
1.70 |
Topology/Maps/Proper/CompactlyGenerated.lean |
1.73 |
Analysis/Normed/Field/ProperSpace.lean |
1.77 |
Data/Nat/BitIndices.lean |
1.96 |
Topology/Irreducible.lean |
2.03 |
Topology/Algebra/Module/ModuleTopology.lean |
3.01 |
Analysis/LocallyConvex/Polar.lean |
5.00 |
LinearAlgebra/BilinearMap.lean |
7.92 |
CategoryTheory/Limits/VanKampen.lean |
12.26 |
Updating a File
Updating a file in leanclient is generally faster than opening a full file. The time it takes is highly variable and depends on the file, and the size and number of updates.
As an example, we load all except the last 24 lines of a lean file. We benchmark adding these last 24 lines one by one (waiting for full diagnostics in between).
File Path |
Update Rate [lines/s] |
|---|---|
NumberTheory/FLT/Basic.lean |
4.2 |
AlgebraicTopology/DoldKan/Degeneracies.lean |
4.33 |
FieldTheory/Galois/GaloisClosure.lean |
4.59 |
Querying a File
Once a file is opened, querying is relatively fast. Again, this is highly dependent on the file and location in the file.
An empty response (e.g. querying a goal outside a theorem) is typically very fast.
As a benchmark, we repeat the same query 32 times:
Query |
Query Rate [queries/s] |
|---|---|
get_type_definitions |
1497.75 |
get_hover |
1072.87 |
get_folding_ranges |
1003.25 |
get_completion_item_resolve |
630.20 |
get_document_symbols |
397.59 |
get_definitions |
327.61 |
get_call hierarchy incoming |
326.83 |
get_declarations |
324.54 |
get_goal |
248.39 |
get_term_goal |
235.36 |
get_call hierarchy items |
229.16 |
get_semantic_tokens_range |
92.00 |
get_semantic_tokens |
64.16 |
get_references |
52.03 |
get_call hierarchy outgoing |
37.94 |
get_document_highlights |
37.14 |
get_completions |
21.88 |
Parallel processing
Using a LeanClientPool, you can process multiple files in parallel using multiple separate lean language servers:
def count_tokens(client):
  return len(client.get_semantic_tokens())

with LeanClientPool(PROJECT_PATH, num_workers=4) as pool:
  results = pool.map(count_tokens, files, batch_size=4)
The performance increase is dependent on:
num_workers: The number of separate workers with their own lean language server. Scale this with CPU cores.
batch_size: Batching allows the language server to open multiple files in parallel. Typically faster but requires more resources (mainly memory). Beware of large batch_sizes.